

Taking complex data and turning it into visual assets allows you to refine your business processes including customer service, mapping the buyer’s journey and keeping your employees engaged and happy.
Experts predict the global data visualization market will reach a growth rate of over 9% by 2024. As more businesses realize the benefits of data visualization, expect rates to increase even more.
Here are some ways you can visualize processes in your company and improve customer relations.
1. Simplify Complex Concepts
Depending upon your industry, you may have to explain complex definitions and concepts to customers. One way of breaking down data into something easier to understand is by offering data visualizations. You can show the user rather than telling them.
You’ve probably seen simplification of complex terms when viewing pie charts, graphs and images representing numbers.
2. Walk Customers Through the Buyer’s Journey
What is your sales process like? If customers have to take too many steps or don’t know what’s expected, they may bounce away from your site and go elsewhere. Fortunately, you can improve your buyer’s journey with visualizations laying out the stages.
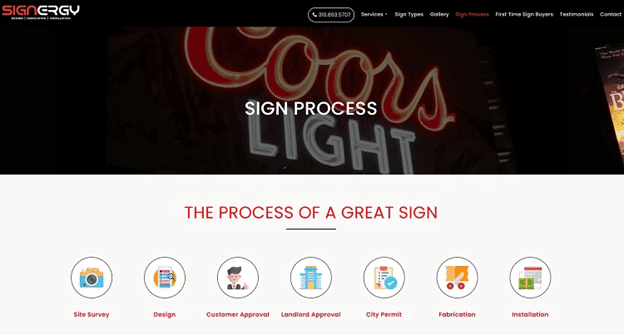
Signergy uses visualizations to lay out the process they go through to create an amazing sign for their customers. Leads know exactly what to expect before contacting the company.
They show the start of the process, which is a site survey. They then move into design, customer approval, landlord approval, pulling city permits, fabricating the sign and final installation.
3. Improve Communication
You can also use visuals to improve communication between your team members and the customer. Presenting a graph of what works must be completed on a project and allowing participants to check off boxes shows the client where you’re at on the project and how many hands work to create something amazing for the customer.
4. Offer Comparisons
Your customer may be on the fence about whether or not to buy from you. You can use visualizations to show the benefits of choosing you over a competitor and list them out in an infographic that pulls at the reader’s emotions. You can also compare different models of the same product.
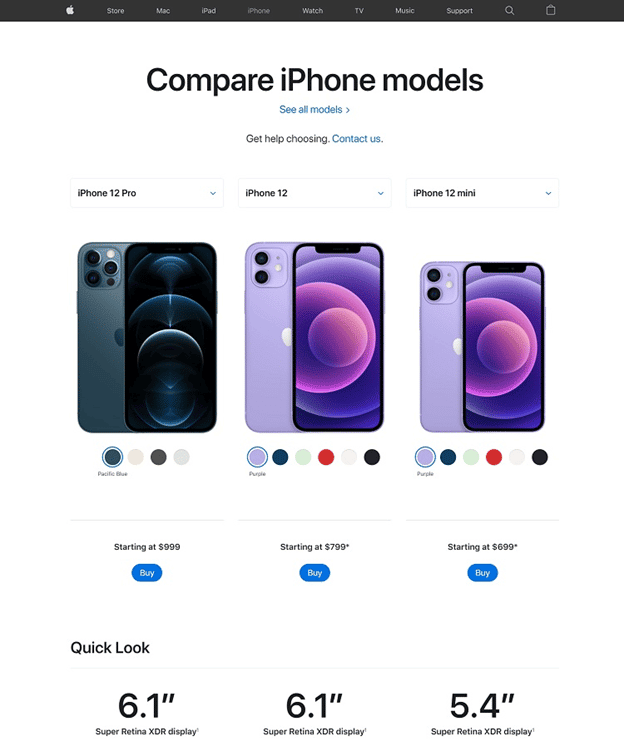
iPhone offers a variety of phone models each year. Their comparison visualization shows the difference in size on your screen. You also see features, such as available colors, display type and pricing.
Communicate Better
Visualizing your process helps you communicate better with your customers. They will understand the scope of the product or service they’re buying. You’ll reduce the number of questions they have for your sales team and they’ll be more satisfied with the finished product as they’ll fully know what to expect. They say a picture is worth 1,000 words, so use your visualizations wisely to create a bridge between you and your clients.